Built-in Datasets in Python
Python modules containing built-in datasets and ways to access them
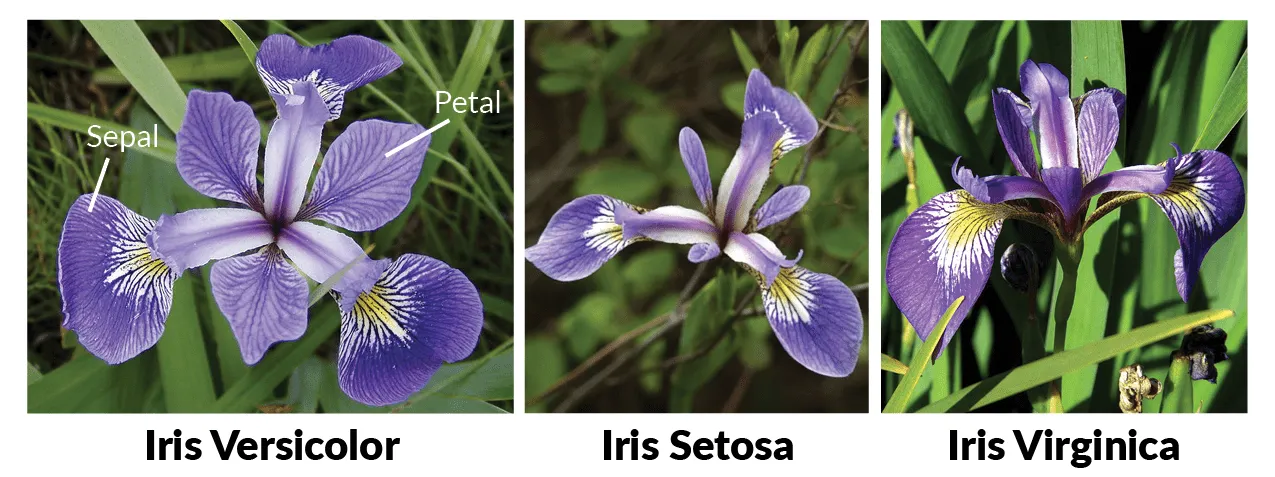
Built-in datasets prove to be very useful when it comes to practicing ML algorithms and you are in need of some random, yet sensible data to apply the techniques and get your hands dirty. Many modules in python house some common datasets of the likes of the popular ‘Iris’ data. In this article, we will see the datasets available within ‘sklearn’ and ‘statsmodels’ modules, and ways to access the data and related info. Short demonstrations to load a dataset each for classification, text analytics, image processing and time series analysis is provided.
Datasets in ‘sklearn’
To see the list of datasets provided by Sci-kit learn module, execute the below command.
from sklearn import datasets
dir(datasets)
You will get the directory of contents available in ‘datasets’ of which below are the ones containing data that can be used for regression, classification, text analysis and image processing. For example, ‘20newsgroups’, ‘20newsgroups_vectorized’ are for text analytics; ‘california_housing’ for regression; ‘digits’ for image processing; ‘iris’, ‘wine’ for classification.

There are other attributes present as well, such as make_blobs, make_biclusters, make_circles and so on that come handy for plotting and visualizations.
Data Attributes
The main attributes of the datasets that you need to be aware of are:
DESCR: to get a comprehensive description of the dataset
data: to fetch the data of independent variables (features)
target: to fetch the target variable
feature_names: to get the names of features
target_names: to get the names of target classes (target field name in case of regression data)
Data for Classification
Here’s a quick demonstration with ‘wine’ dataset to view the results of the above mentioned attributes.
print(datasets.load_wine().DESCR)

It is imperative to use the print function with ‘DESCR’, otherwise the output comes in an illegible format.
To read the data of features as a dataframe and set the feature names, execute the below:
import pandas as pd
wine_data = pd.DataFrame(datasets.load_wine().data)
wine_data.columns = datasets.load_wine().feature_names
wine_data.head(5)
Finally, to get the target variable, run the following line of code.
wine_target = datasets.load_wine().target
print(wine_target)
Similar steps can be followed to get the data ready for regression problems.
Data for Text Analytics
The ‘20newsgroups’ dataset consists of ~18000 newsgroups posts on 20 topics split in two subsets — one for model training and the other for testing. The ‘fetch_20newsgroups_vectorized’ loader is the processed version of ‘fetch_20newsgroups’ data, where feature extractor is already used.
Here’s how you get the data ready for text processing.
from sklearn.datasets import fetch_20newsgroups_vectorized as news
newsgroups_train = news(subset='train').data
newsgroups_train
In order to convert the Compressed Sparse Row (CSR) format to the original matrix, the following function in ‘scipy’ can be used.
import scipy
from scipy.sparse import csr_matrix as csr
train_matrix = csr.todense(newsgroups_train)
train_matrix
Converting the matrix to pandas dataframe:
import pandas as pd
train_data = pd.DataFrame(train_matrix)
train_data.head()
Getting the target classes for each record in the training data:
y_train = news(subset='train').target
y_train
The target classes take value from 0 to 19 corresponding to the 20 topics in the newsgroups data. To map these values to the corresponding topic names, we can use the target_names attribute.
news().target_names
Similarly, the test data can be obtained in the same fashion if you replace (subset = ‘train’) with (subset = ‘test’) in the above steps.
Data for Image Processing
Finally, lets get some data for image processing. ‘load_digits’ dataset contains ~1800 images of hand-written digits from 0 to 9. Each image is of 8x8 dimensions translating to 64 attributes per image. Loading the data is very similar to that of classification or regression datasets.
import pandas as pd
digits = pd.DataFrame(datasets.load_digits().data)
digits['target'] = datasets.load_digits().target
digits.tail()
In order to visualize the image, the original matrix can be taken and reshaped into 8x8, and matplotlib can be used for displaying. The index of digits_matrix below can be changed to visualize the corresponding images in the dataset.
# Code to display the first image #
digits_matrix = datasets.load_digits().data
import matplotlib.pyplot as plt
plt.figure(figsize=(10,10))
plt.imshow(digits_matrix[0].reshape(8,8))
plt.show()


Datasets in ‘statsmodels’
‘Statsmodels’ module also houses few built-in datasets that can be used for classification, regression and time series analysis.
from statsmodels import datasets
dir(datasets)
Data Attributes
The key attributes of the datasets are:
NOTE : to get the dimensions and feature descriptions of the data
DESCRSHORT, DESCRLONG : get the description about the data
SOURCE : get info about the data source
load_pandas : to fetch the data
Given below is a quick demo with ‘elnino’ dataset that can be used for time series analysis.
print(datasets.elnino.DESCRSHORT)
print(datasets.elnino.DESCRLONG)
print(datasets.elnino.NOTE)
print(datasets.elnino.SOURCE)
It is important to use print function along with NOTE, DESCR and SOURCE attributes so as to get the output in a readable format.
datasets.elnino.load_pandas().data
Now, the data is ready and you are all set to play around with various ML algorithms!